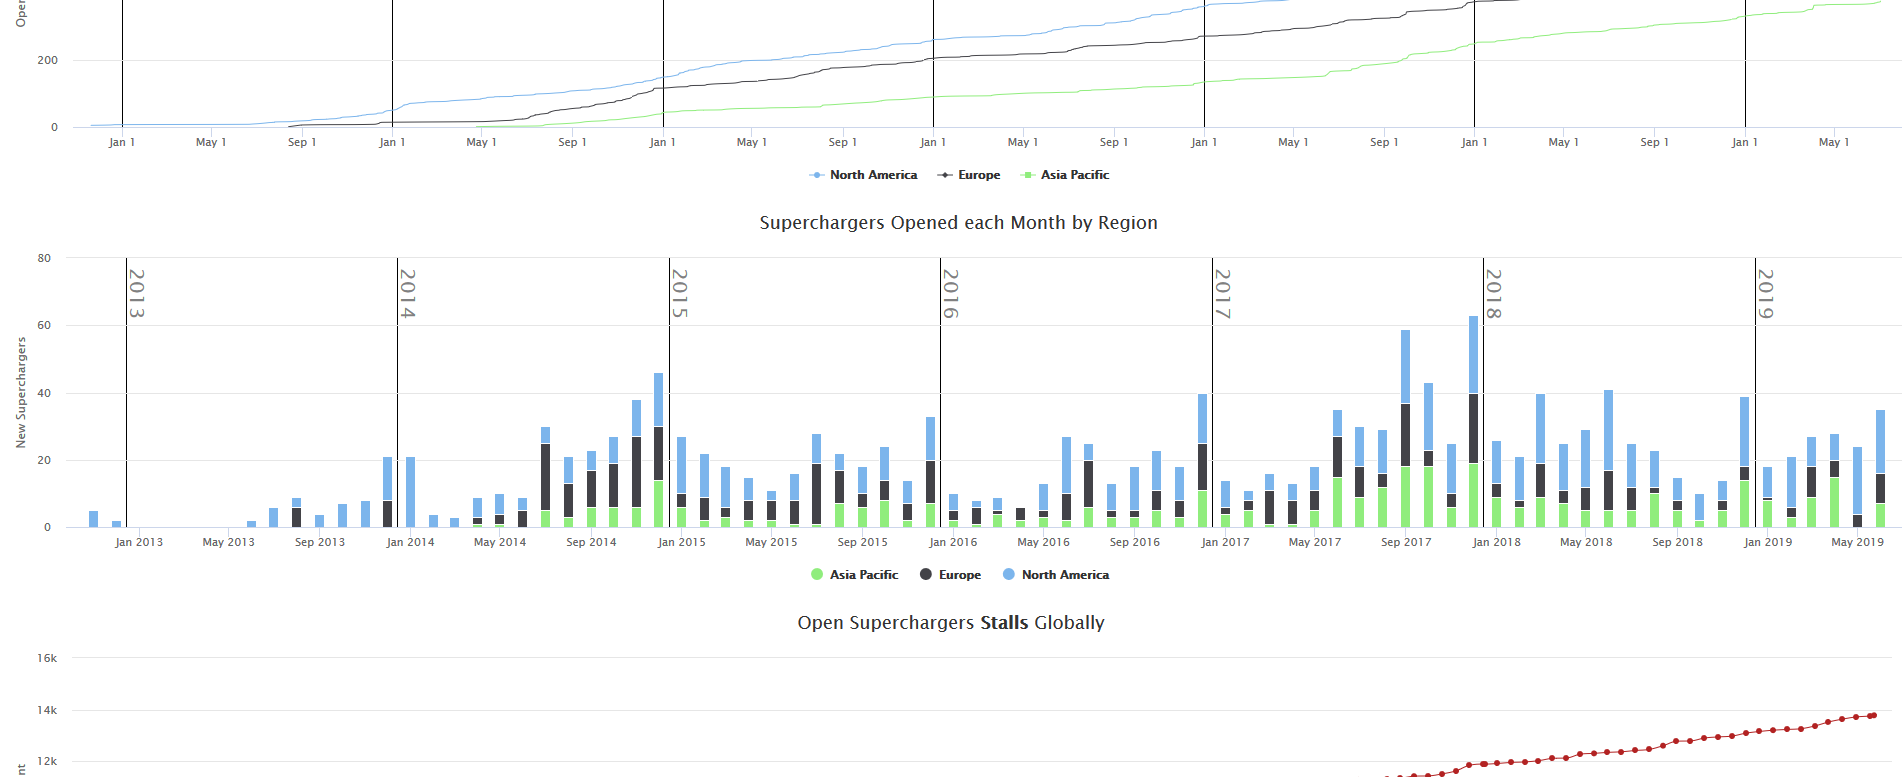
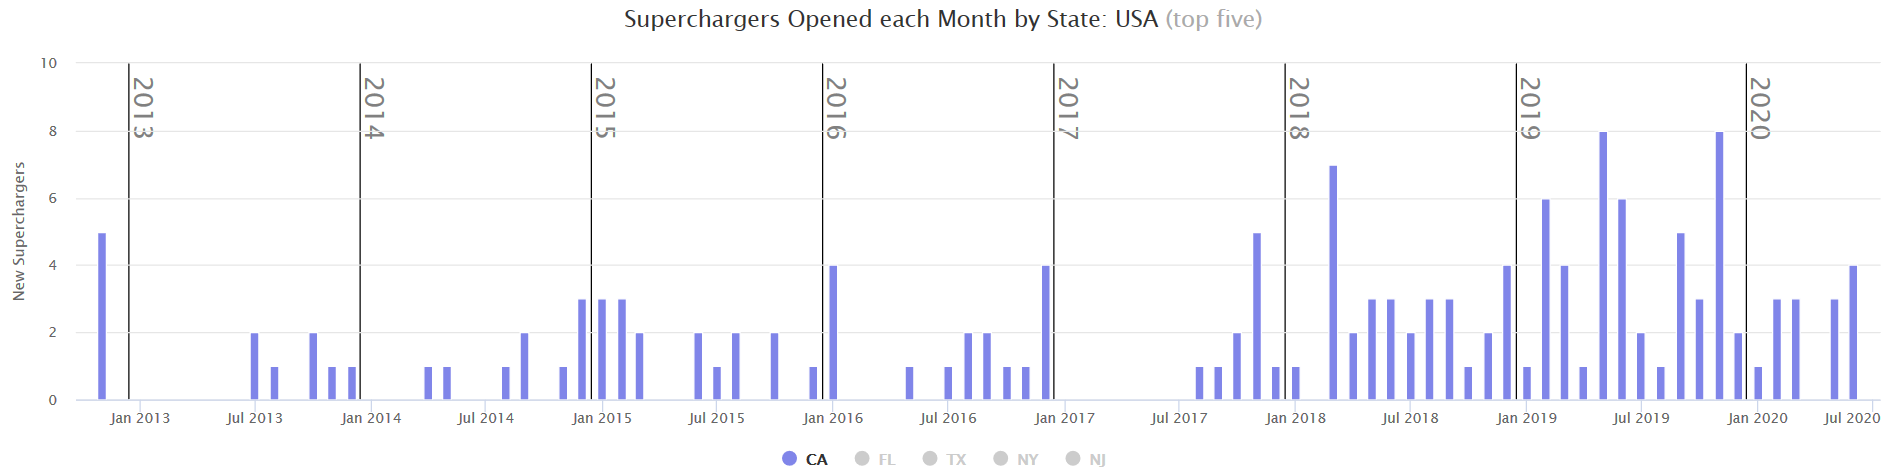
I decided to fork the supercharge.info codebase and take a stab at working on some additional charts (basically the features suggested here). To start off with, you can see the equivalent of this chart below (except the graph on TMC is for stalls):
I’m also planning on organizing the charts page so you can navigate to the type of chart you want to see. Anyways, are there any suggestions for other changes while I’m at it?
First, I think I’ve figured out how to organize the charts page. There will be two main tabs, which are historical charts (this shows changes to the Supercharger network over time) and today’s charts.
For historical charts, each filter will include four types of charts to view at once:
Stacked continent data
Side by side continent data
Top 5 country data
Country data excluding US/China
The filters you’d be able to apply here are by choosing which status you’d like to look at (permit, construction, or open) and which type of growth (cumulative/total supercharger line chart, new superchargers per month bar chart, or percentage of all statuses per country/region line chart). The default would be total open over time, but you could also choose to view a moving percentage of superchargers under construction over time. The only thing missing here is switching between supercharger location counts and supercharger stall counts; this data isn’t quite available historically (this is all there is right now).
For today’s charts, it would be the remainder of the charts page as it exists today:
Pie chart of top 5 countries
Bar chart of all countries besides US and China
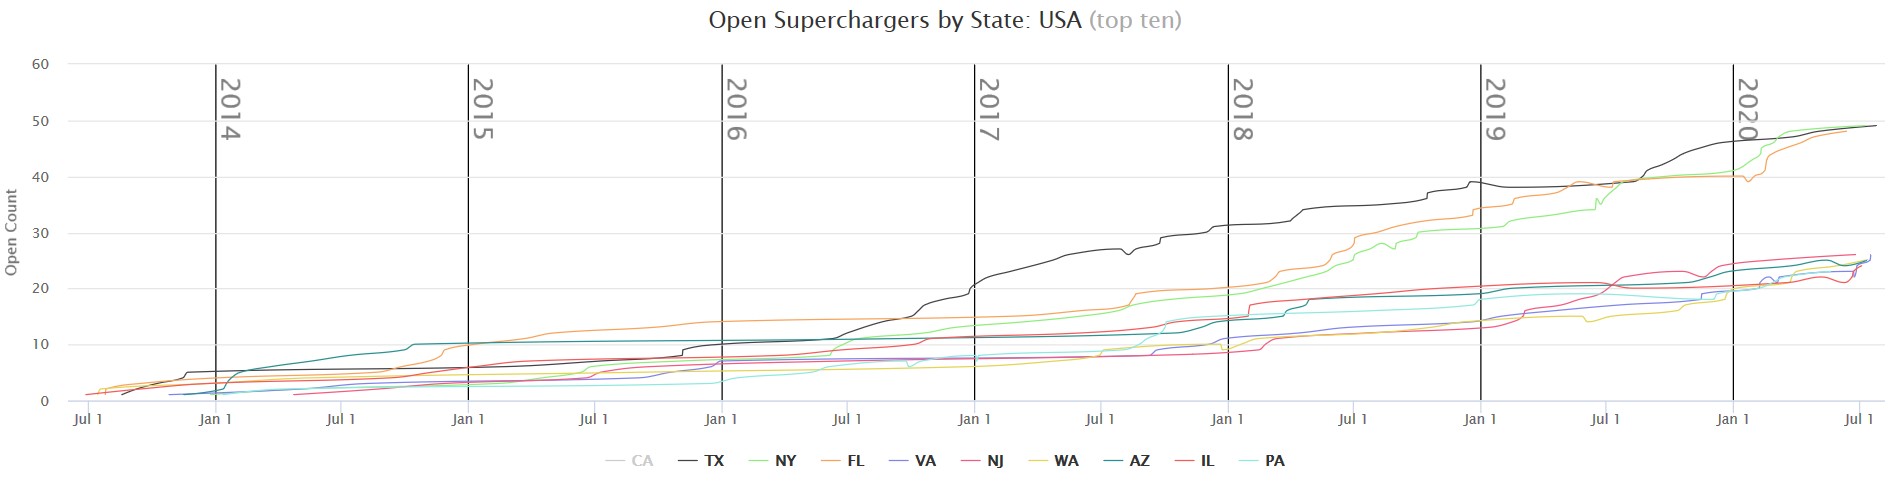
Bar chart of all US states
Bar chart of all Chinese provinces
Bar chart of length of times that each supercharger has been under construction/permit
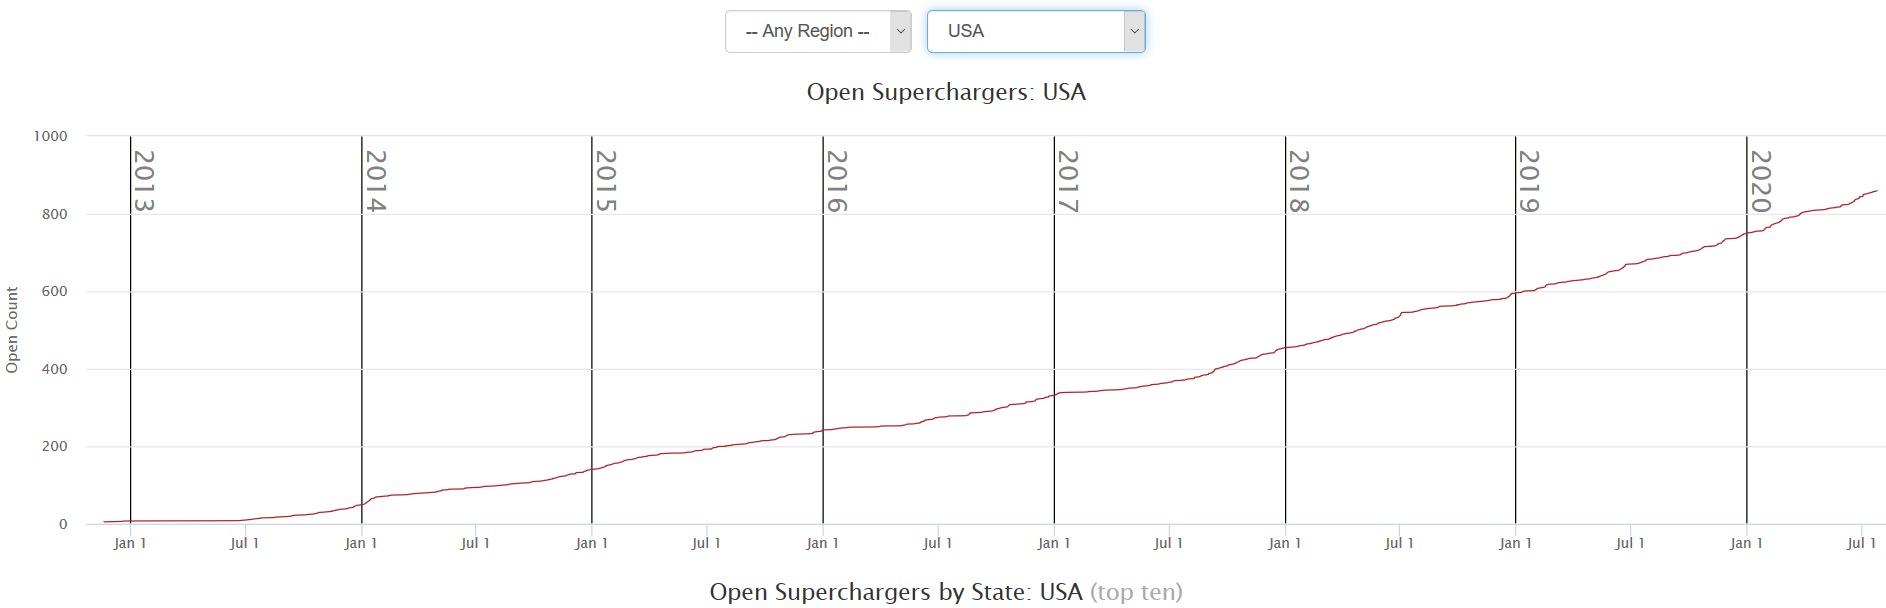
Second, I’ve successfully recreated the Open Superchargers by Region chart using change data reliably (as opposed to only the open date). This lets me create historical charts for any status (instead of only the open status). The work I’ve done here also makes it easy for me to display the change history when you click to view a supercharger location.
It’s been a year since I last worked on this, but I spent a few hours on it today. I don’t expect it to be much longer before it’s complete since I’m changing my strategy to get this work completed sooner (plus to maintain a simpler interface). I’m basically only putting in filters by region/country like the Changes and Data tabs have. The infrastructure for this is complete and I already have some charts generate based on the filters selected.
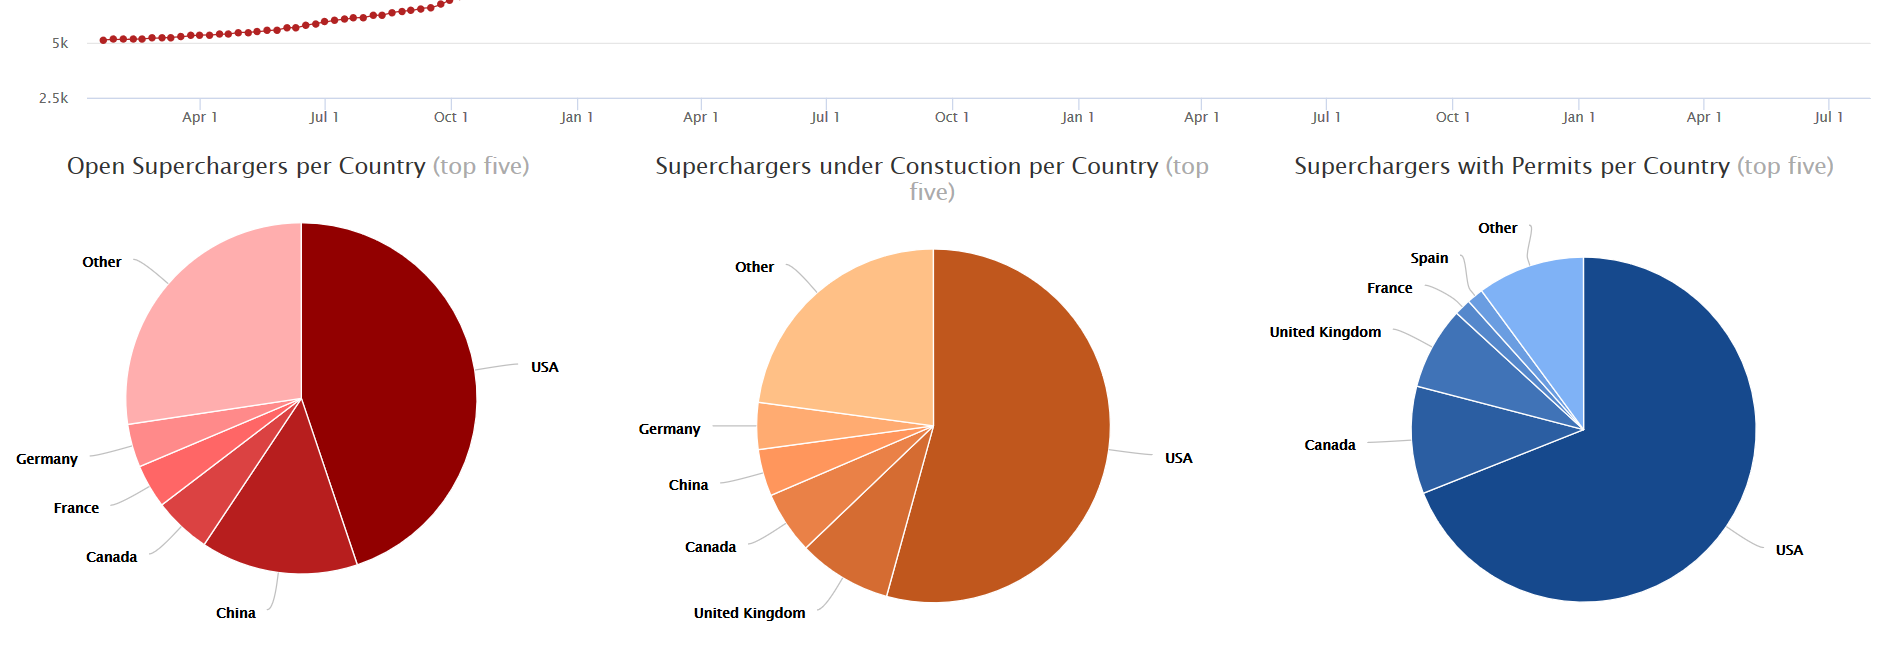
Along with the stacked bar chart above, I’ve also created a couple of new pie charts for number of sites open by construction and permit statuses as pictured below:
I finished up the feature today and have a little more work to do before submitting a pull request (merge in latest changes the main branch and do a little benchmarking). Anyways here are screenshots of when different filters are applied… @keith A heads up.
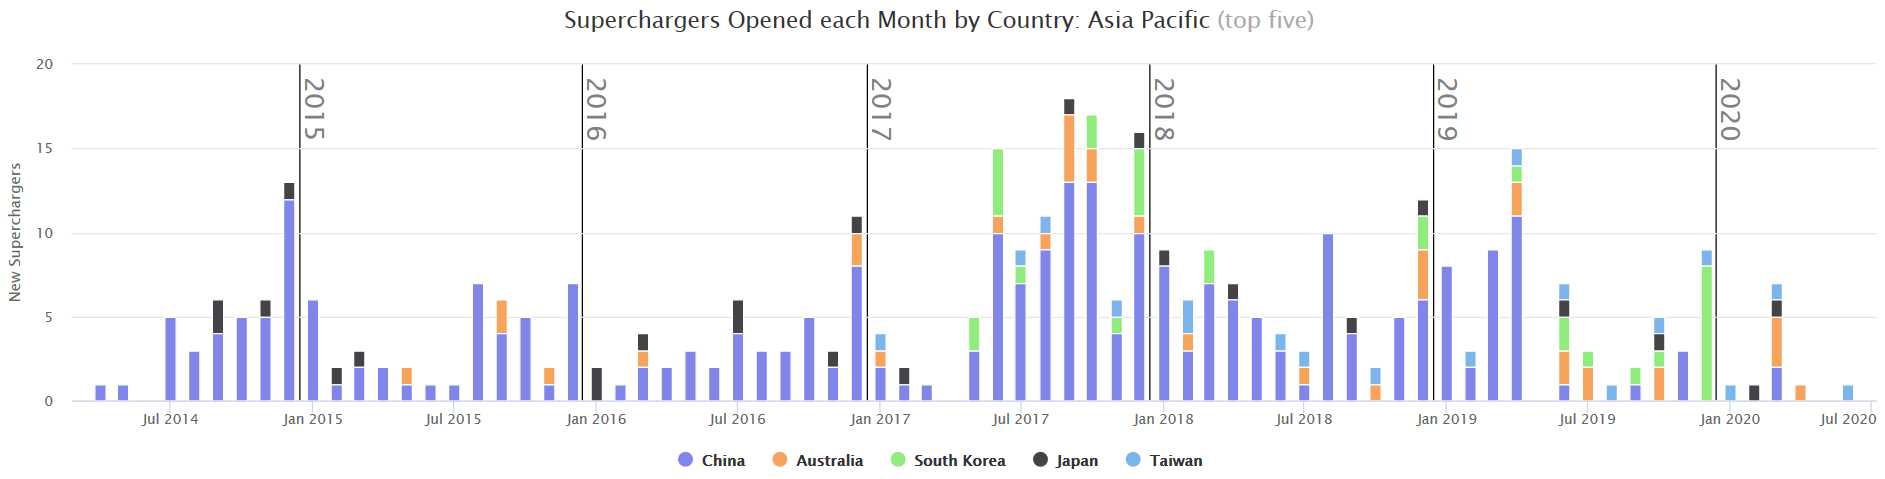
The same chart as above but with “Asia Pacific” region filter applied (here it’s obvious that China’s supercharger growth has plummeted in the last year):
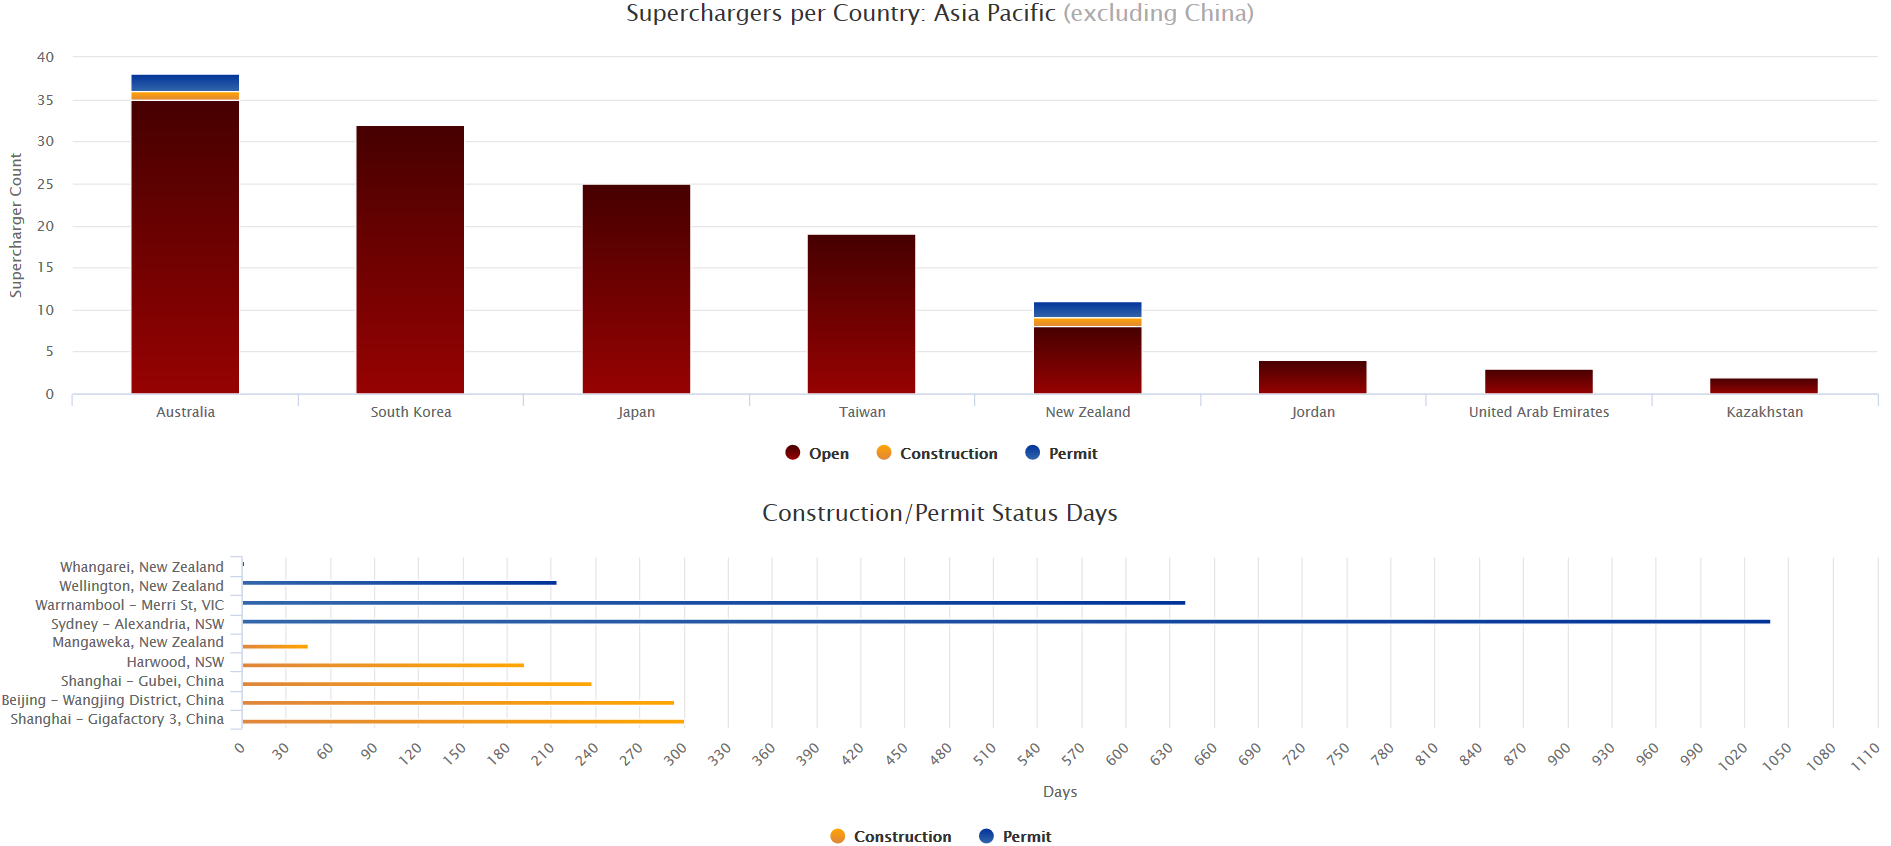
The last two charts with the same filter as above (notice how it dynamically excludes only China from the bar chart and dynamically resizes the status days chart):
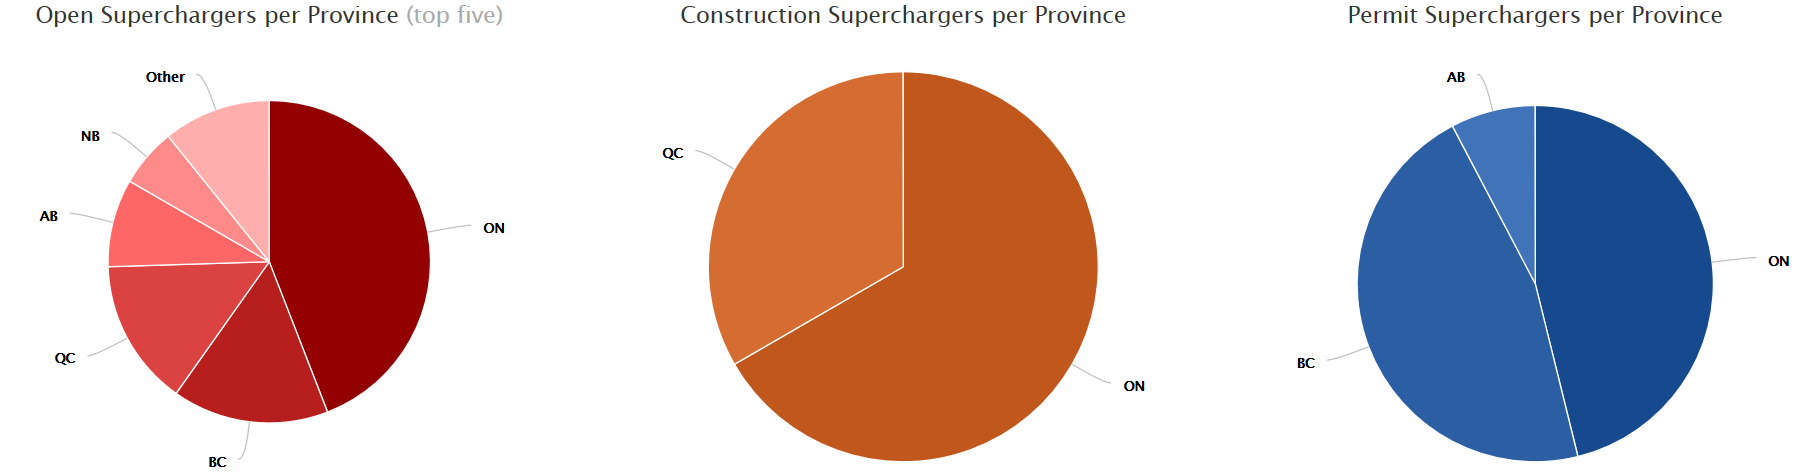
Two other things I’ll note is that any “state” charts will show up when applying a filter of Australia, Canada, China, and USA, and that the word “province” or “state” will be correctly used depending on which country is selected. An example… (Could probably use better titles for the pie charts, but I’ll leave it up to someone else to decide)
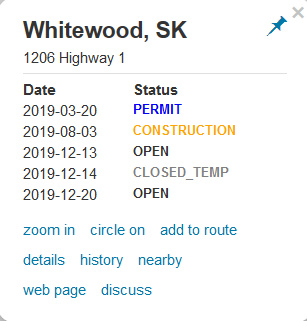
One last change I just made is I added a “history” link when viewing the info popup of a supercharger site on the map. If the stall count history was available in the front-end data, I’d include it but it’s not. Supercharge.info editors only have access to this behind a login and the repository for supercharge.info is separate from the database models so additional data can’t be made available by me. Anyways I’ve submitted the pull request: https://github.com/kdwink/supercharge.info/pull/49
Brilliant work @Pluto. As an aside is it possible to allow edits to “hide” status changes? I’ve been guilty on more than one occasion of preemptively changing sites to “open” after a successful charge, only to find the following day the site is back down for a few weeks.
That’s not to say the history shouldn’t be there and visible, just making the “changes” tab cleaner.
I mean in my opinion, the best way would be to allow (some) editors to remove change entries (perhaps only within the last week?).
Another way (more convoluted) would be to build in some rules in whichever places desired to hide an “OPEN” change entry/status if the open date (which is a separate field) is empty or comes later than the status change. The data could even just represent the date field of the first “OPEN” change entry as the open date from the supercharger object. Then if a mistake is made, the edit to correct it is to temporarily remove the open date but leave the status as open. Once it’s actually open, assigning the open date would start including under the correct date.
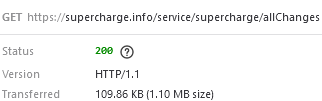
The changes page currently gets data directly from the back-end (using this service URL which includes pagination built in), so afaik the only easy way to accomplish this would be on that side (not something I could do).
If I remember correctly I had some concerns about the performance impact (especially for mobile devices) of fetching the 1+MB of change json on every visit, and then always iterating all thousands of changes, spanning all time, building thousands of lists (one for each site, globally), even for visitors that didn’t look at per-site history or charts. Planned to just add an an API endpoint that allowed fetching changes per site on demand, before merging. But I have never made time to come back to it. My apologies for not giving Pluto feedback or updating this thread with the status.
Which brings up a larger issue. I probably need to step away from this project and let someone else take over. I just haven’t had the time (in the last few years really) to be a good coordinator.
Nearly every weekend I would like to make time for some serious work but inevitability don’t–which ends up making me feel bad or somewhat guilty because of the patreon income.
Anyone interested in taking over? I haven’t made the api code and admin code available previously because they utilize some of my own libraries that I won’t publish, but looking at it now, nothing that couldn’t be easily replaced (string utils, very light weight data access layer). The API is written in java.
Possibly there is way I can transfer the patreon account or, if not, at least a few months of contributions (which would cover a few years of hosting). Other things that could be handed over:
The main site and this forum (two linux VMs hosted at linode.com currently $10/month each).
The forum is open source software and administration consists of occasional updates (UI + command line), approving requests for editor, and occasionally approving/rejecting suspicious posts.
The VM for the main site consists of just postgres DB + the API running on tomcat.
I currently backup both VMs to my home but looks like we could switch that to automatic backup of the VM images by the host for $2.5/month each.
There is a map@supercharge.info email address that still receives change reports occasionsally, but I have been trying to direct peole to the forum instead-- so maybe we can just shut that email address down to eliminate the 6$/month cost.
I would move the supercharge.info code out of my github.com org into it’s own and add the source for the API and admin pages.
There are currently no cost associated with the maps (openstreetmap) but it is possible to change a line of code or two (MayLayers.js, line 11) and switch to nicer mapbox.com maps, at cost.
I am interested. My background is in web and application hosting on Linux, and I feel very comfortable running sites like these. I would love to be able to help move supercharge.info development forward.
If I remember correctly I had some concerns about the performance impact (especially for mobile devices) of fetching the 1+MB of change json on every visit, and then always iterating all thousands of changes, spanning all time, building thousands of lists (one for each site, globally), even for visitors that didn’t look at per-site history or charts. Planned to just add an an API endpoint that allowed fetching changes per site on demand, before merging. But I have never made time to come back to it. My apologies for not giving Pluto feedback or updating this thread with the status.
I’ll need to double check this as it’s been some time, but I believe I looked into this when I was developing the feature and that it only compiled the chart data once you visited that tab (where most of the computation exists). Regarding the site history, I don’t think the computation involved any real transformations of the dataset and I figure it to be close to linear O(n) time only (maybe with a multiple but nothing significant). You’re right that it does download 1 MB file, however it’s compressed to a 10th of the size. When I had tested with an older mobile device (my iPhone 6S) on a remote network over VPN, I don’t believe I noticed any real impact.
But again, it’s been some time and is definitely worth double checking before going forward, probably just adding an API for each site history at the right times.

