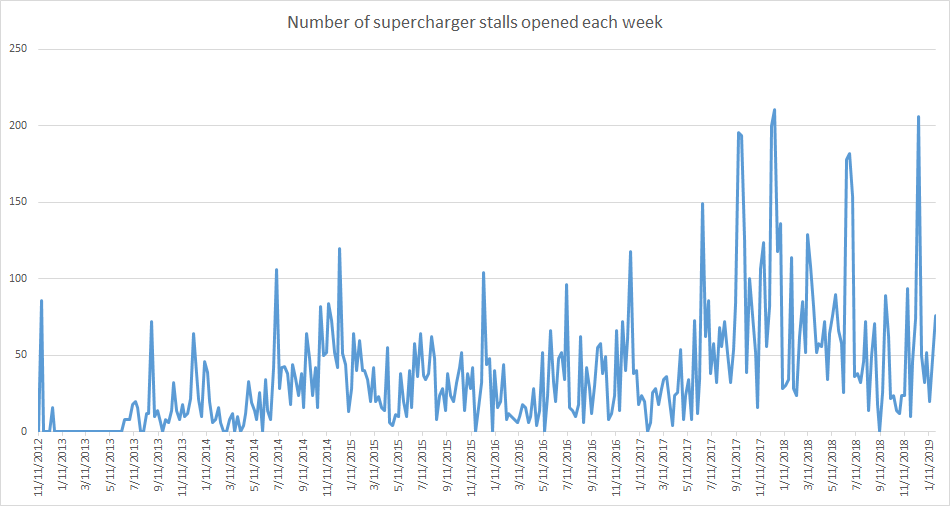
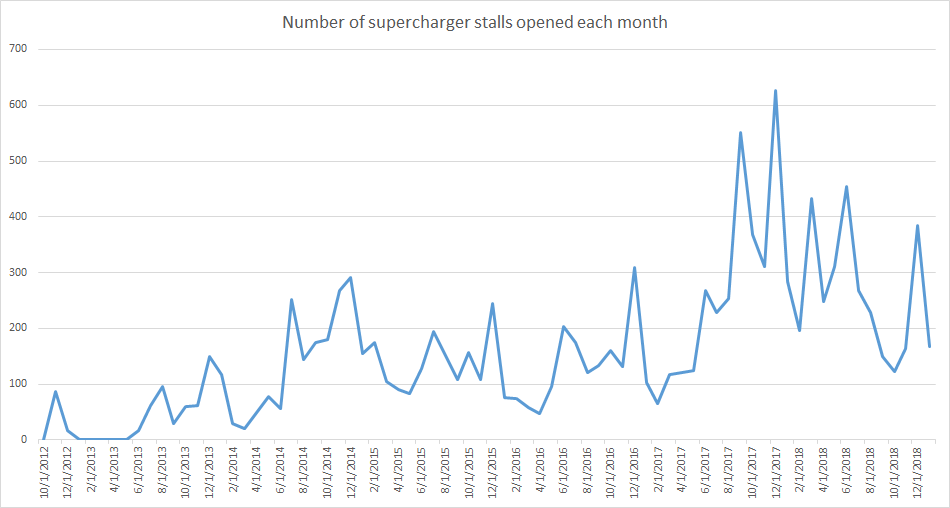
This is kinda off-topic to the original purpose of the thread, but I made the graph anyways by only using the open date of each location:
You can generate the same data, based on this source data. Assign the JSON to a sites variable, run one of the following code blocks with JavaScript, copy the output into Excel, and make a graph. In Firefox you can assign the JSON by browsing to the page and running var sites = JSON.parse(JSONView.json.data).
Weekly data:
// Filter out non-opened locations, order by date
var sites2 = sites.filter(function(a){return !!a.dateOpened})
  .sort(function(a,b){return new Date(a.dateOpened)>new Date(b.dateOpened)});
var current = '2012-11-11'; // Select prior week to show start at 0 stalls/week
var latest = new Date(current); // Select date to increment at
latest.setUTCDate(latest.getUTCDate()+7);
var dates = {};
dates[current] = 0; // Set initial data
for(var i=0; i<sites2.length;) { // Populate data
  if(latest<=new Date(sites2[i].dateOpened)){ // Increment week
    current=latest.toISOString().substring(0,10);
    latest.setUTCDate(latest.getUTCDate()+7);
    dates[current]=0;
  }else{ // Add location data to week and increment location
    dates[current] += sites2[i++].stallCount;
  }
}
if(new Date() < latest) {
  delete dates[current]; // Prevent showing a plummet because of incomplete data
}
var d=Object.keys(dates);
for(var i=0, s=''; i<d.length; i++){
  s += d[i] + '\t' + dates[d[i]] + '\r\n';
}
console.log(s); // Output data delimited by tabs to paste into Excel
Monthly data:
// Filter out non-opened locations, order by date
var sites2 = sites.filter(function(a){return !!a.dateOpened})
  .sort(function(a,b){return new Date(a.dateOpened)>new Date(b.dateOpened)});
var current = '2012-10-01'; // Select prior month to show start at 0 stalls/month
var latest = new Date(current); // Select date to increment at
latest.setUTCMonth(latest.getUTCMonth()+1);
var dates = {};
dates[current] = 0; // Set initial data
for(var i=0; i<sites2.length;) { // Populate data
  if(latest<=new Date(sites2[i].dateOpened)){ // Increment month
    current=latest.toISOString().substring(0,10);
    latest.setUTCMonth(latest.getUTCMonth()+1);
    dates[current]=0;
  }else{ // Add location data to month and increment location
    dates[current] += sites2[i++].stallCount;
  }
}
if(new Date() < latest) {
  delete dates[current]; // Prevents showing a plummet because of incomplete data
}
var d=Object.keys(dates);
for(var i=0, s=''; i<d.length; i++){
s += d[i] + '\t' + dates[d[i]] + '\r\n';
}
console.log(s); // Output data delimited by tabs to paste into Excel