I was going to make a historical graph of how many stalls have been opened each week but it looks like the prior stall count for locations that have been expanded is missing. For example, Dublin - Amador Plaza, CA has been expanded, but the original updates on the Changes page when the location was first built now show the latest stall count.
Is this information just not publicly accessible because estimates are put in at times that are later corrected? If so can the stall count be added retroactively for each change with status=OPEN until the prior OPEN (since we know the stall counts at OPEN shouldn’t be erroneous based on Tesla’s official data)?
You can generate the same data, based on this source data. Assign the JSON to a sites variable, run one of the following code blocks with JavaScript, copy the output into Excel, and make a graph. In Firefox you can assign the JSON by browsing to the page and running var sites = JSON.parse(JSONView.json.data).
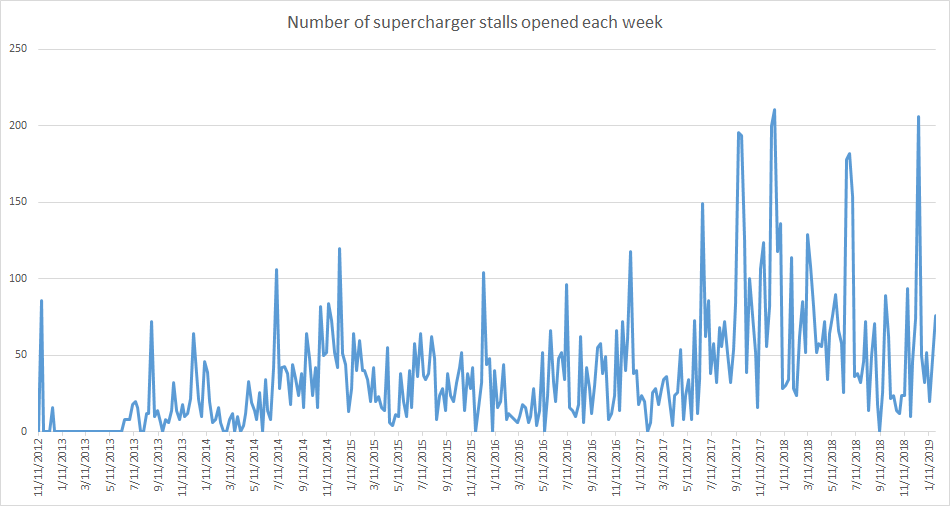
Weekly data:
// Filter out non-opened locations, order by date
var sites2 = sites.filter(function(a){return !!a.dateOpened})
  .sort(function(a,b){return new Date(a.dateOpened)>new Date(b.dateOpened)});
var current = '2012-11-11'; // Select prior week to show start at 0 stalls/week
var latest = new Date(current); // Select date to increment at
latest.setUTCDate(latest.getUTCDate()+7);
var dates = {};
dates[current] = 0; // Set initial data
for(var i=0; i<sites2.length;) { // Populate data
  if(latest<=new Date(sites2[i].dateOpened)){ // Increment week
    current=latest.toISOString().substring(0,10);
    latest.setUTCDate(latest.getUTCDate()+7);
    dates[current]=0;
  }else{ // Add location data to week and increment location
    dates[current] += sites2[i++].stallCount;
  }
}
if(new Date() < latest) {
  delete dates[current]; // Prevent showing a plummet because of incomplete data
}
var d=Object.keys(dates);
for(var i=0, s=''; i<d.length; i++){
  s += d[i] + '\t' + dates[d[i]] + '\r\n';
}
console.log(s); // Output data delimited by tabs to paste into Excel
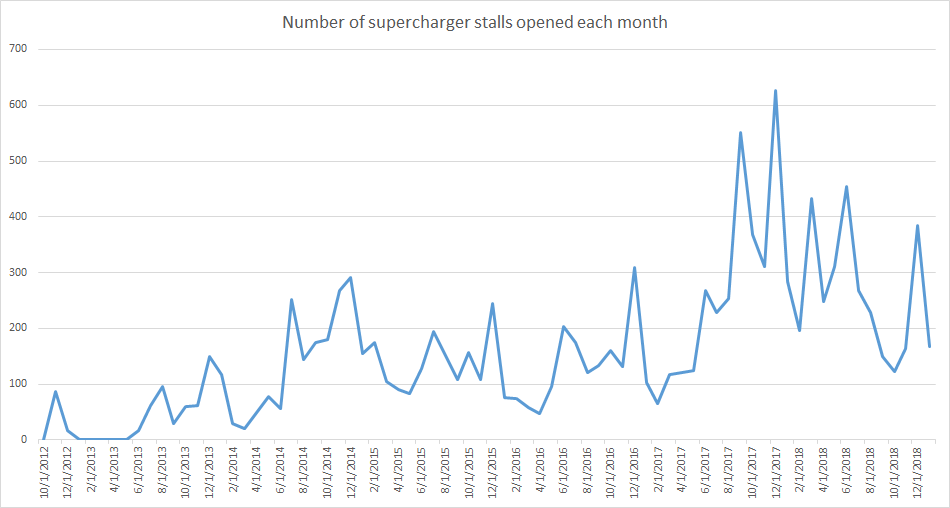
Monthly data:
// Filter out non-opened locations, order by date
var sites2 = sites.filter(function(a){return !!a.dateOpened})
  .sort(function(a,b){return new Date(a.dateOpened)>new Date(b.dateOpened)});
var current = '2012-10-01'; // Select prior month to show start at 0 stalls/month
var latest = new Date(current); // Select date to increment at
latest.setUTCMonth(latest.getUTCMonth()+1);
var dates = {};
dates[current] = 0; // Set initial data
for(var i=0; i<sites2.length;) { // Populate data
  if(latest<=new Date(sites2[i].dateOpened)){ // Increment month
    current=latest.toISOString().substring(0,10);
    latest.setUTCMonth(latest.getUTCMonth()+1);
    dates[current]=0;
  }else{ // Add location data to month and increment location
    dates[current] += sites2[i++].stallCount;
  }
}
if(new Date() < latest) {
  delete dates[current]; // Prevents showing a plummet because of incomplete data
}
var d=Object.keys(dates);
for(var i=0, s=''; i<d.length; i++){
s += d[i] + '\t' + dates[d[i]] + '\r\n';
}
console.log(s); // Output data delimited by tabs to paste into Excel
It would also be interesting to see what supercharger locations that are getting expanded or have been expanded on the changes tab. Status tags could be “under expansion” and "recently expanded.
When clicking on a location it would also be interesting to see data for this, such as when the expansion has taken places, or upgrade to higher voltage/charger version. I’ve seen suggestions about adding info about how many CCS chargers, perhaps data on how many spaces for cars with trailers are available.